
LinkedIn Ads,
Simplified
Track ROAS, CTR & CPA for LinkedIn campaigns in Google Sheets — no setup required.
WHY SIGNALLIFT WORKS
Everything You Need. Nothing You Don’t.
Instant KPIs
Automatically calculates ROAS, CTR & CPA from raw LinkedIn ad exports.
Compare Performance
Easily filter by campaign and date to see current vs. prior trends—no pivot tables.
Built for Solo Marketers
Skip Data Studio and BI tools. SignalLift gives you clear, client-ready metrics—fast.
SEE IT IN ACTION
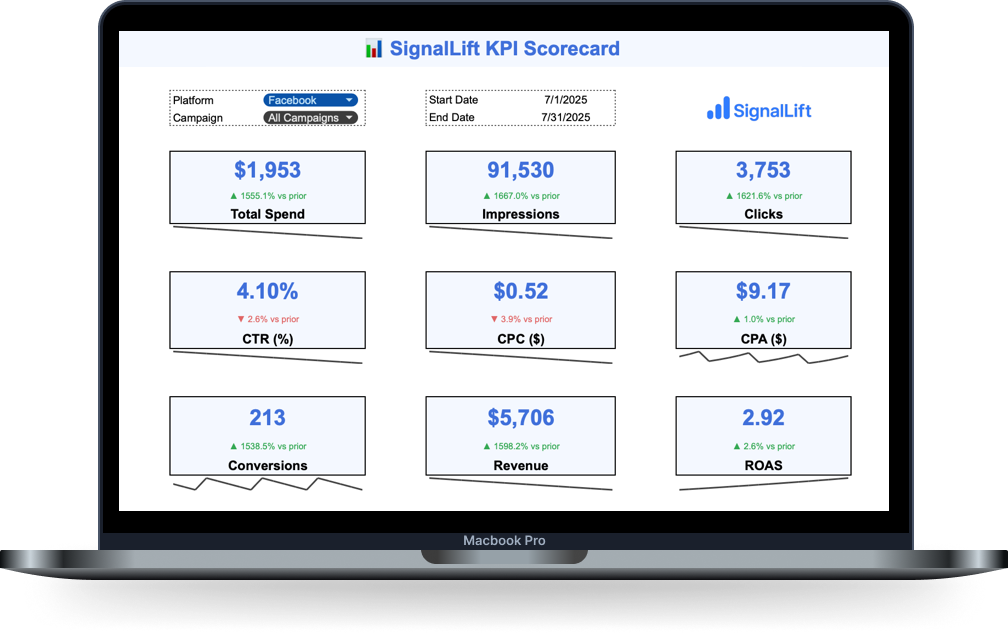
Your Campaigns, Crystal Clear.
Easily monitor ROAS, CTR, and CPA in one clean LinkedIn dashboard — no pivot tables or extra setup required. Just drop in your data and go.
WHY MARKETERS LOVE SIGNALLIFT
Smarter Reporting, Less Effort.
No Learning Curve
Skip the hours in Data Studio or Excel. SignalLift works the moment you drop in your raw ad data.
Track Key Metrics
Instantly see ROAS, CTR, and CPA trends without building pivot tables or managing multiple sheets.
Save Hours Weekly
Automate your reporting workflow so you can spend more time optimizing campaigns and less time formatting.
HOW WE STACK UP
SignalLift vs. Manual Reporting & Looker Studio
| Manual Excel/Sheets | Looker Studio | SignalLift | |
|---|---|---|---|
| Setup Time | 2–4 hrs per report | 1–2 hrs plus connectors | 5 minutes |
| Platform Coverage | Manual CSV for each | Connectors (extra cost) | Meta, Google, TikTok, LinkedIn |
| Comparative Insights | Manual Pivot Tables | Requires Custom Setup | Built-In |
| Cost | Free but time-intensive | Free + $15–50/mo connectors | One-Time $19 |
Get Clear Ad Performance in Minutes
Skip the pivots, formulas, and BI tools — SignalLift shows your key metrics instantly.
One-time payment • Instant access • No subscription required